- June 15,2018 | ISSN 1940-6967
- American Society of Registered Nurses ®


Featured Sponsors


This Map Shows Your Risk Of Getting Divorced By State
By Joshua A. Krisch
Couples living in Iowa and Hawaii seem to stick it it out, with divorce rates as low as 20 percent. Oklahoma, on the other hand, boasts a 65.7 percent divorce rate.

It’s a myth that half of all marriages end in divorce. True, divorce rates in the United States peaked at around 50 percent in 1980, but those scary statistics have since declined to the point that the current risk of divorce is closer to 40 percent. As with most national statistics, however, numbers vary greatly from state to state. Couples living in Iowa and Hawaii seem to stick it out; those states have divorce rates near 20 percent. Couples in Oklahoma, however, don’t seem to have the stomach for it and get divorced at a startling 65.7 percent rate, meaning two out of every three marriages end in paperwork.
Here’s a map of divorce rates per state, compared to countries from around the world, including America (way to be average Illinois):

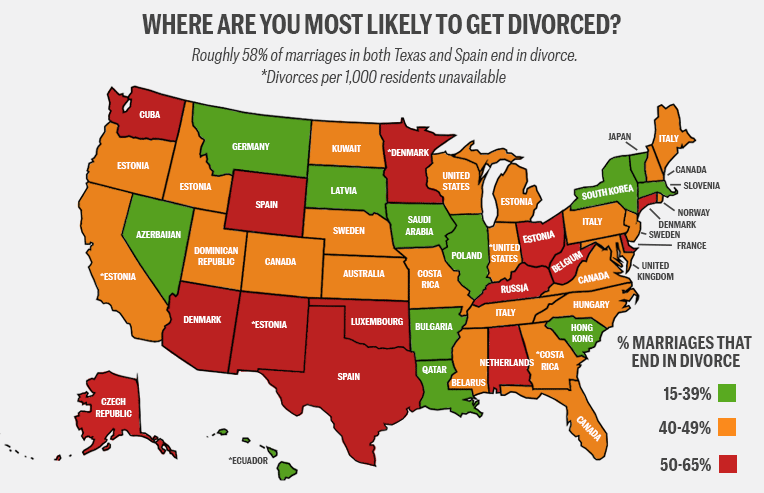
The country data in this map comes from Eurostat, the European Union’s own statistical branch. The state data comes from the Centers for Disease Control and Prevention. To figure out the percent of marriages that end in divorce for each state, we borrowed the EU’s method and divided divorce rates by marriage rates for 2016, and then multiplied the solution by 100. Not too tricky and it gets the job done. That said, there are several caveats to consider when viewing this map. First of all, the following six states provide the CDC with marriage rates, but do not provide data on divorce rates: California, Georgia, Hawaii, Indiana, Minnesota, and New Mexico. For these states, we assumed the average U.S. divorce rate of 3.2 per 1,000 people, which may be (and likely is) inaccurate.

It is also noteworthy that Nevada’s stellar divorce record on our map is almost certainly overstated. Since divorce risk is a function of marriage rate, and many people who do not live in Nevada get married in Las Vegas, Nevada has glaringly inaccurate marriage statistics. The average marriage rate in the U.S. is 6.9 per 1,000—Nevada’s is 28.4. Unfortunately, since Nevada is also the divorce capital of the country (4.3 per 1,000 vs the U.S. average of 3.2) we cannot fix this by simply assuming the national average for marriage or divorce rates. Nevada is a question mark on our map, and it’s reasonable to assume its actual rates are about average.
No matter what state you’re from, remember that location simply isn’t what is going to cause your marriage to dissolve. Infidelity, money problems, and addictions end most marriages according to divorce attorneys and speaking openly about your struggles, whether emotional or sexual, can prevent nip many marriage problems in the bud. Consider marriage counseling if you’re struggling to get along with your spouse—especially when kids are in the picture.


Articles in this issue:
- Suicide Contagion
- Virtual Reality Is Getting Used By Hospitals A Lot. Here's How It Helped One Woman Forget She Was In Labor
- Millennials Are Getting Anxious From Venmo
- More College Students Enrolling Emotional Support Animals.
- Hipster Parents Admit They Regret Their Baby's Cool Names
- How To Reverse Aging And Become Whoever You Want To Be
- Suicide Rates Rise Sharply Across The United States, New Report Shows
- This Map Shows Your Risk Of Getting Divorced By State
Featured Sponsors


In This Issue
- Suicide Contagion
- Virtual Reality Is Getting Used By Hospitals A Lot. Here's How It Helped One Woman Forget She Was In Labor
- Millennials Are Getting Anxious From Venmo
- More College Students Enrolling Emotional Support Animals.
- Hipster Parents Admit They Regret Their Baby's Cool Names
- How To Reverse Aging And Become Whoever You Want To Be
- Suicide Rates Rise Sharply Across The United States, New Report Shows
- This Map Shows Your Risk Of Getting Divorced By State
Archives
- May 15, 2026
- April 15, 2026
- March 15, 2026
- February 15, 2026
- January 15, 2026
- December 15, 2025
- November 15, 2025
- October 15, 2025
- September 15, 2025
- August 15, 2025
- July 15, 2025
- June 15, 2025
- May 15, 2025
- April 15, 2025
- March 15, 2025
- February 15, 2025
- January 15, 2025
- December 15, 2024
- November 15, 2024
Masthead
-
Masthead
Editor-in Chief:
Kirsten Nicole
Editorial Staff:
Kirsten Nicole
Stan Kenyon
Robyn Bowman
Kimberly McNabb
Lisa Gordon
Stephanie Robinson
Contributors:
Kirsten Nicole
Stan Kenyon
Liz Di Bernardo
Cris Lobato
Elisa Howard
Susan Cramer


Leave a Comment
Please keep in mind that all comments are moderated. Please do not use a spam keyword or a domain as your name, or else it will be deleted. Let's have a personal and meaningful conversation instead. Thanks for your comments!

*This site is protected by reCAPTCHA and the Google Privacy Policy and Terms of Service apply.